


SAMHSA data as of November 16, 2026
How far is treatment from each Colorado county?
For all 64 counties in Colorado, the table measures how many miles separate the county center from the closest detox, the closest live-in program and the closest medicine clinic. Detox is more than 30 miles off for 664,308 people in 43 counties. No treatment site exists in 11 counties.
Keep two things nearby: the ZIP code and the insurance card (yours or your loved one's). You'd reach a paid referral line. It's answered by a partner, not any program on this site.
All 64 counties
Closest detox distance sets the order. Driving is longer than these straight-line miles.
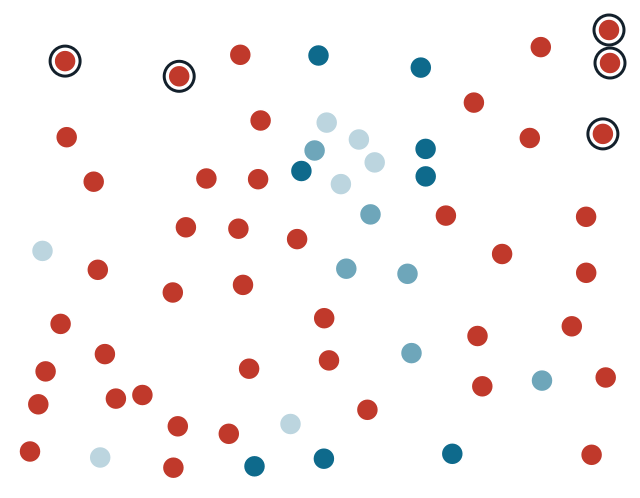
- up to 10 mi 7
- 10–20 mi 6
- 20–30 mi 8
- over 30 mi 43
- Farthest: Sedgwick 133 mi, Phillips 130 mi, Yuma 127 mi, Moffat 105 mi, Routt 97 mi
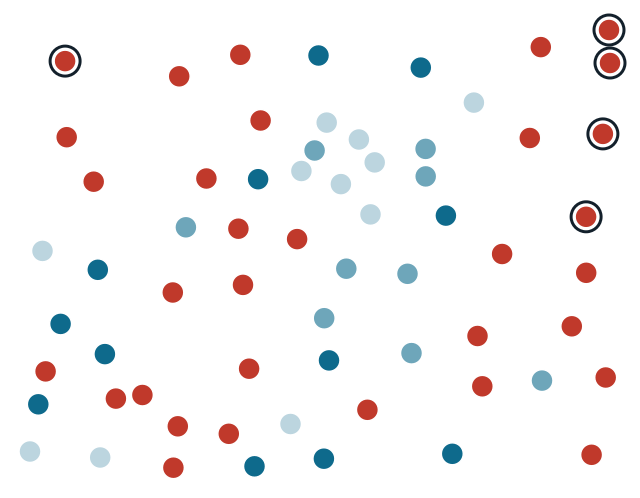
- up to 10 mi 11
- 10–20 mi 9
- 20–30 mi 12
- over 30 mi 32
- Farthest: Sedgwick 92 mi, Kit Carson 86 mi, Moffat 85 mi, Phillips 84 mi, Yuma 74 mi
| County | Residents (2024) | Facility count | Detox, mi | Residential, mi | MAT, mi |
|---|---|---|---|---|---|
| Sedgwick County | 2,257 | 0 | 132.7 | 92.5 | 92.5 |
| Phillips County | 4,488 | 1 | 130.2 | 84.0 | 84.0 |
| Yuma County | 10,048 | 1 | 126.7 | 74.3 | 74.3 |
| Moffat County | 13,142 | 1 | 104.7 | 84.6 | 87.8 |
| Routt County | 25,243 | 2 | 97.2 | 64.6 | 67.7 |
| Logan County | 20,755 | 1 | 93.0 | 56.6 | 56.6 |
| Kit Carson County | 7,080 | 1 | 91.1 | 85.9 | 57.9 |
| Pitkin County | 16,643 | 4 | 86.5 | 13.4 | 13.4 |
| Washington County | 4,771 | 1 | 86.1 | 34.0 | 34.0 |
| Gunnison County | 17,310 | 1 | 83.7 | 40.2 | 10.9 |
| Chaffee County | 20,780 | 0 | 79.1 | 58.3 | 36.0 |
| Eagle County | 54,330 | 1 | 78.0 | 31.9 | 31.9 |
| Jackson County | 1,273 | 0 | 69.3 | 66.2 | 66.0 |
| Lincoln County | 5,598 | 1 | 65.4 | 60.2 | 20.9 |
| Baca County | 3,367 | 1 | 64.3 | 64.3 | 51.6 |
| Lake County | 7,369 | 0 | 64.2 | 43.6 | 43.6 |
| Cheyenne County | 1,712 | 1 | 62.1 | 62.1 | 54.0 |
| Rio Blanco County | 6,607 | 1 | 61.8 | 52.9 | 55.3 |
| Ouray County | 5,197 | 0 | 59.3 | 23.2 | 15.1 |
| San Miguel County | 7,819 | 1 | 58.4 | 44.2 | 34.0 |
| Morgan County | 30,300 | 3 | 53.6 | 9.5 | 9.5 |
| Mineral County | 933 | 0 | 49.6 | 49.6 | 46.6 |
| Montrose County | 44,806 | 3 | 48.4 | 21.6 | 21.8 |
| Summit County | 30,882 | 3 | 48.4 | 24.4 | 41.8 |
| Garfield County | 63,167 | 4 | 47.3 | 30.4 | 31.4 |
| Dolores County | 2,467 | 1 | 46.9 | 27.0 | 40.5 |
| Grand County | 16,154 | 0 | 46.0 | 35.3 | 44.3 |
| Prowers County | 11,957 | 2 | 45.4 | 45.4 | 13.9 |
| Custer County | 5,553 | 0 | 43.7 | 27.2 | 42.2 |
| Hinsdale County | 747 | 0 | 43.7 | 43.7 | 24.7 |
| Huerfano County | 6,988 | 2 | 43.6 | 43.6 | 43.7 |
| Archuleta County | 14,112 | 1 | 42.8 | 42.8 | 42.8 |
| Saguache County | 6,670 | 1 | 42.2 | 42.2 | 31.8 |
| Fremont County | 50,093 | 3 | 41.2 | 14.4 | 40.8 |
| Montezuma County | 26,841 | 3 | 41.1 | 0.8 | 40.1 |
| Park County | 18,316 | 0 | 39.4 | 39.4 | 39.4 |
| Delta County | 32,215 | 1 | 38.3 | 26.2 | 14.2 |
| Elbert County | 29,382 | 3 | 35.4 | 23.8 | 23.3 |
| San Juan County | 821 | 0 | 34.8 | 34.8 | 13.1 |
| Crowley County | 5,600 | 1 | 34.3 | 34.3 | 34.2 |
| Kiowa County | 1,392 | 1 | 32.8 | 32.8 | 24.3 |
| Otero County | 17,991 | 1 | 30.7 | 30.7 | 30.3 |
| Rio Grande County | 11,132 | 3 | 30.1 | 30.1 | 17.6 |
| Adams County | 542,973 | 29 | 28.7 | 17.0 | 27.0 |
| Las Animas County | 14,518 | 3 | 27.7 | 27.7 | 68.8 |
| Costilla County | 3,686 | 2 | 26.9 | 26.9 | 26.9 |
| Larimer County | 374,574 | 12 | 26.3 | 22.2 | 22.2 |
| Clear Creek County | 9,076 | 4 | 25.2 | 2.1 | 17.0 |
| Weld County | 369,745 | 8 | 24.7 | 22.3 | 20.9 |
| Conejos County | 7,549 | 2 | 23.4 | 23.4 | 12.7 |
| Arapahoe County | 666,918 | 38 | 22.6 | 13.5 | 20.6 |
| Teller County | 24,862 | 1 | 18.5 | 11.4 | 18.3 |
| Gilpin County | 5,963 | 1 | 18.2 | 13.4 | 16.7 |
| Douglas County | 393,995 | 8 | 17.2 | 4.2 | 16.2 |
| Bent County | 5,779 | 2 | 12.4 | 12.4 | 12.3 |
| El Paso County | 752,772 | 30 | 11.6 | 12.5 | 11.6 |
| Pueblo County | 169,866 | 14 | 10.2 | 10.2 | 10.1 |
| Boulder County | 330,262 | 18 | 9.6 | 6.9 | 7.9 |
| Alamosa County | 16,689 | 5 | 8.8 | 8.8 | 8.0 |
| Broomfield County | 78,323 | 1 | 7.1 | 5.2 | 3.2 |
| Mesa County | 161,260 | 9 | 5.2 | 5.2 | 4.7 |
| Denver County | 729,019 | 50 | 2.3 | 2.1 | 1.1 |
| Jefferson County | 578,533 | 31 | 2.2 | 2.2 | 2.2 |
| La Plata County | 56,823 | 4 | 0.9 | 0.9 | 0.9 |
Don't know where to begin?
Can't pick a program yet? Call any listed program yourself, or use the referral line below.
You'd reach a paid referral line. It's answered by a partner, not any program on this site.
Method
Facilities: all Colorado programs in SAMHSA FindTreatment.gov reporting detox or substance use treatment (snapshot November 16, 2026). County centers: the 2024 Gazetteer from the U.S. Census Bureau. Head counts: Census estimates for 2024. ZIP code decides a facility's county (Census ZCTA-to-county file). Miles are great-circle: from each county's internal point straight to the coordinates a facility lists; if SAMHSA gives no coordinates, the Census Geocoder finds them from the address, and a listing without a street goes to its ZIP code center. MAT includes certified opioid treatment programs (OTP). The data is free to reuse with a link here.